Population and decay dynamics on Sb2Te2S

The population as a function of kinetic energies at different time delays is shown in the false-color plot below and in the video above. The plot is integrated over all angles k||, where the video shows a cut along the ky|| direction. For negative time delays the UV pulse arrives before the IR. For positive delay the IR pulse is in front of the UV pulse. Because the intensities decrease towards higher kinetic energies, the contrast is enhanced by multiplying the signal with a factor that depends linearly on the kinetic energy.
At negative time delay two image-potential states are visible. At positive delay a surface state with negative effective mass appears. From this state the electrons relax into the conduction band minimum and the Dirac cone.
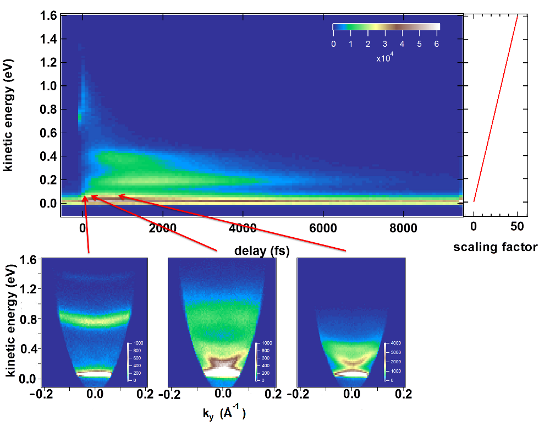
The Figures show the energy dispersion at three different timescales. For a better contrast the color scale is adjusted.